How I Helped Reduce Churn For A Multi-Million Dollar Marketing Agency.
Prologue
After building successful businesses targeting thousands of B2C clients, I’ve been finding myself more interested in expanding my network of B2B clients. At first sight, they might seem completely different but the core truth remains the same: people pay if you provide them value. This is my current philosophy: dig deep, provide value and you will be hard to replace.
Discovery
Paid marketing was a domain I had never interacted or worked with, as my SaaS businesses had grown and scaled organically. Thus, when Oscar asked me for help with their marketing agency Viralclip I was very interested in working with them.
Viralclip is a marketing agency which serves mainly SaaS companies, helps them grow and scale their businesses with paid Meta Ads. They handle millions of dollars in monthly ad spend, and they manage dozens of accounts. So of course I started with my favourite question to gather value:
A – Where is the bottleneck in your business right now?
O – Staffing, delegating, and overseeing the client ad accounts assigned to our employees. We are at maximum capacity.
Prioritising
With this context in mind, I focused on what I could develop that would provide most value first of all. Providing Viralclip’s team insights on their clients’ ad accounts performance. This should reduce the time management spends trying to see which metrics have been changing week-to-week and they can better assign their internal tasks, to improve client retention.
Messy Data
Before deciding what to build exactly, I first understood which systems they were working with. Viralclip uses GoHighLevel as their CRM, which has an API and makes things easier. However, their client’s ad accounts are hosted under Meta Ads platform and there was nothing connecting them.
With their business context, I was able to map their clients from GoHighLevel to their Meta Ads account identifiers. The idea is to try to provide signals of clients which are at risk of churning, connecting both systems.
Client Constraints
For completing this project, we just need read access to their data. However, throughout the whole development process it’s always good to think about future improvements and features that can be built on top, which I will touch on at the end of this post.
Architecture
Once I noted down the functional and non-functional requirements, I came up with this architecture.
I built the dashboard as a single system: two ingestion pipelines feeding one Postgres database, one scoring layer, and the places where the team sees the result. The web app is Next.js with Drizzle; a separate worker process runs the schedules; everything ships as one Docker image.
| Layer | What it does |
|---|---|
| Meta ingestion | Pulls daily insights for every ad account in the Business Manager (owned and client accounts), plus ad-account activity and new ads as events. Detects each account’s primary conversion, including named custom conversions. Daily sync, trailing re-pulls and resumable backfills |
| CRM ingestion | A read-only GoHighLevel client syncs paid transactions and contacts. Idempotent and paginated, with rate limits respected |
| Client ↔ account mapping | The client-to-ad-account links provided by the owners, stored with each client, including duplicate contacts merged into one client |
| Billing model | Turns payments into invoices: merges split payments, sets aside add-ons and one-off projects, and learns each client’s billing rhythm. Monthly value = money received ÷ the time it covers |
| Metrics & scoring | Per-account KPIs, period deltas and a trend detector for the ads. Point-in-time client signals: late payment against the client’s own rhythm, invoice drop, results worsening, spend with no results, spend cuts, low spend. Each has a reason, a next step and a weight |
| Evaluation | A backtest replaying every client-week point-in-time, and a weekly snapshot in radar_snapshots for forward validation |
| Reports | A weekly ad-performance report and a weekly client-health report (the ISO week as of its Sunday, compared with the week before), both as dashboard pages, with CSV export and an optional Slack digest |
| Surfaces | The overview (accounts declining plus client health), an account page (KPIs, trend, events and the paying client behind it), the weekly pages and settings |
| Scheduling | The worker runs the daily Meta sync, the trailing re-pulls, and the Monday reports |
The flow is straightforward: the two pipelines land raw data in Postgres, the billing model and the ad metrics turn it into point-in-time signals per client, and those signals feed both the backtest and the weekly reports that the dashboard, the CSV and the (optional) Slack digest read from.
Everything runs as a Docker Compose stack on a single host. Batch jobs (syncs, backfills, backtests) run as one-off containers from a tagged image, so the live app and worker never restart to run them, and every deploy has a rollback tag.
Delivery
The result is an interactive dashboard the team uses, kept up to date by a weekly job. The screenshots below use generated demo data.
Overview
The daily view of every ad account: spend, conversions, ROAS, cost per result and CPM against the previous period, with a status and trend per account. On top, two callouts: the accounts whose results are declining, and client health, which links the ad accounts to the paying clients behind them and shows who is flagged and why.
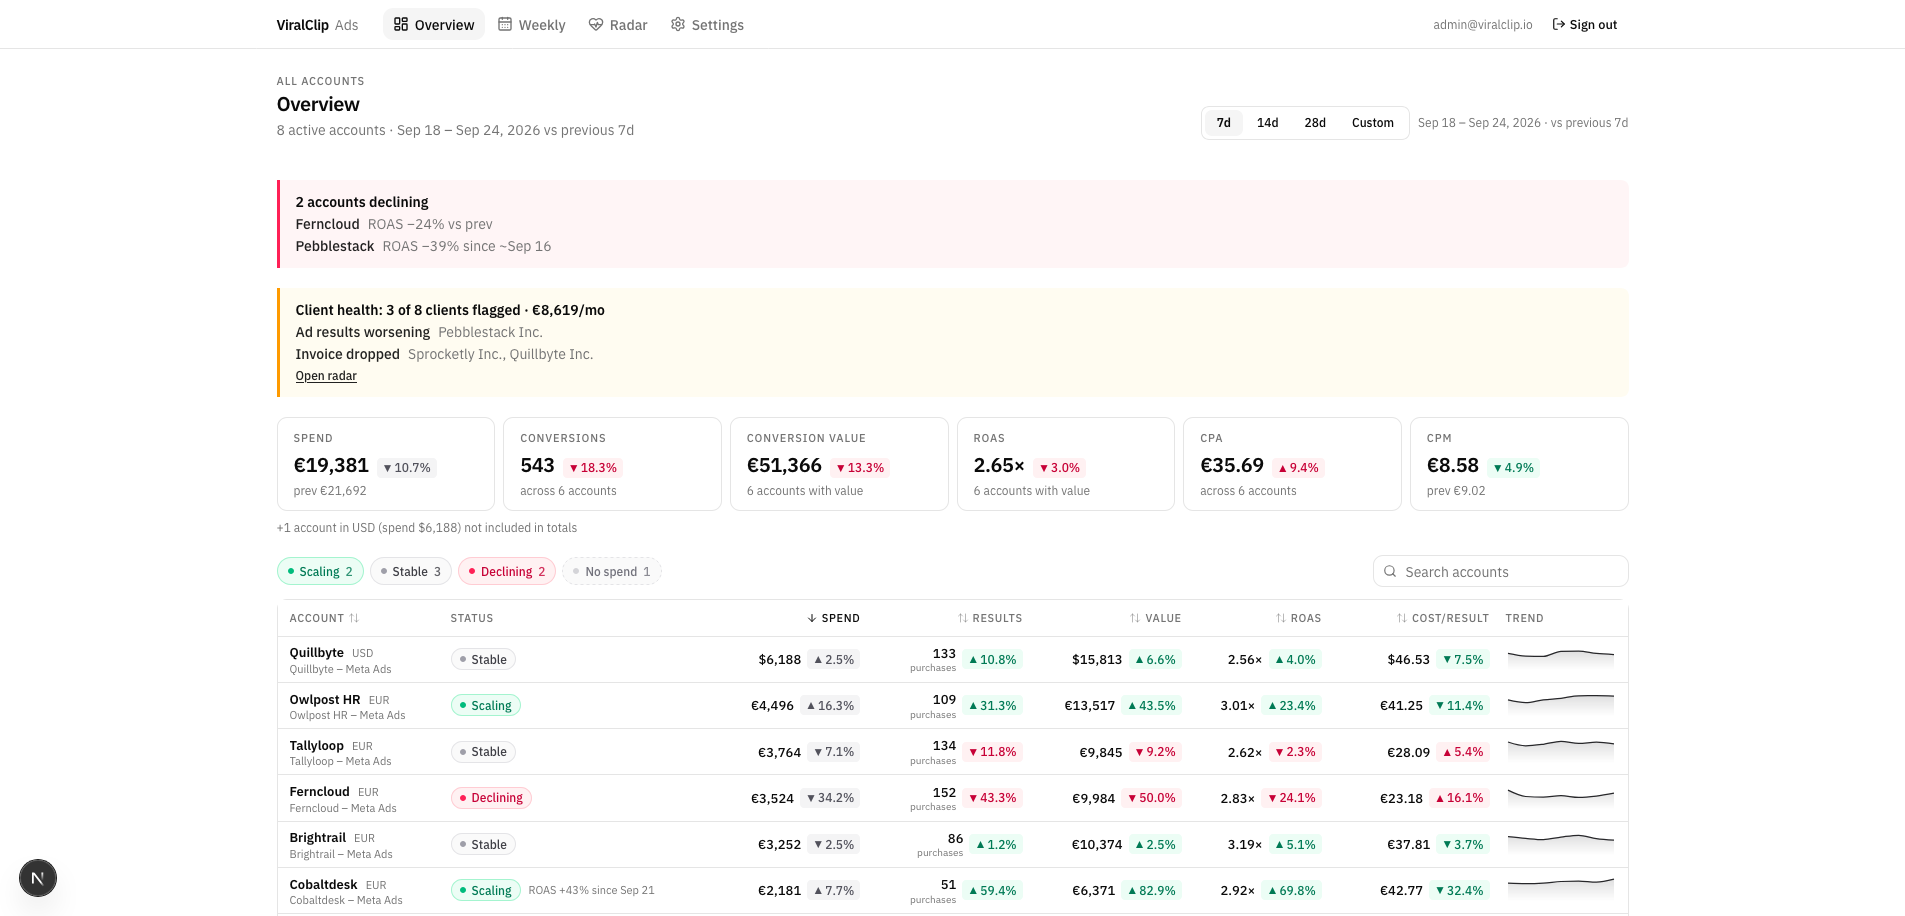 Overview with demo data: ad performance per account, declining accounts and client health.
Weekly ads report
Every Monday, a report for the week that just ended: totals against the previous week, the top movers up and down, the accounts that need attention, and each account’s week-over-week numbers.
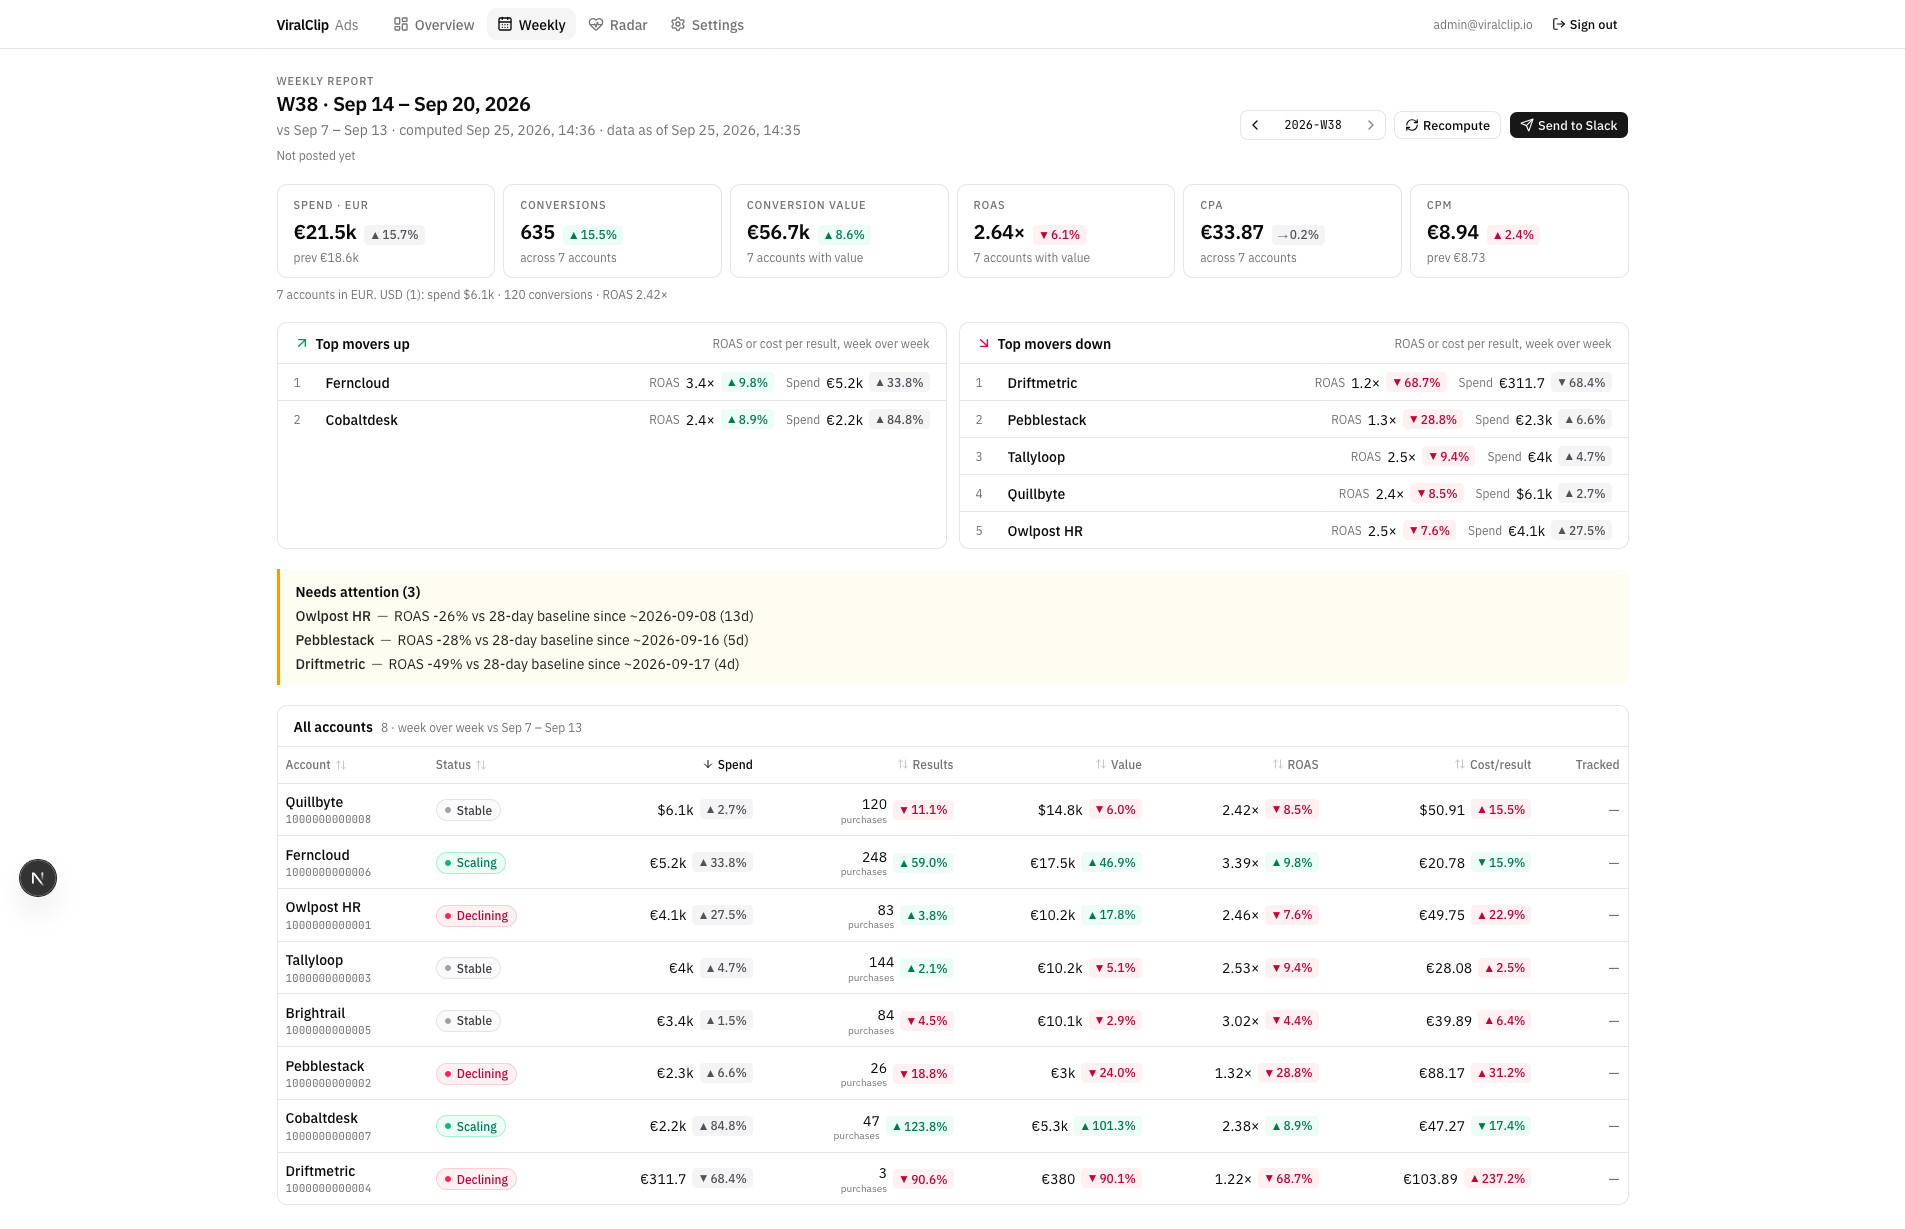 Weekly ads report with demo data.
Client-health radar
The screen the project was built for. For each week it shows:
- Active clients, monthly book and flagged clients, against the week before.
- What changed: newly flagged, no longer flagged, clients who crossed into churn, and new clients.
- Flagged clients grouped by what is wrong, each with a reason and a next step. For example: “Last invoice €2,000, below the usual €5,000 → Ask what changed in scope or budget”.
- A full table and a CSV export.
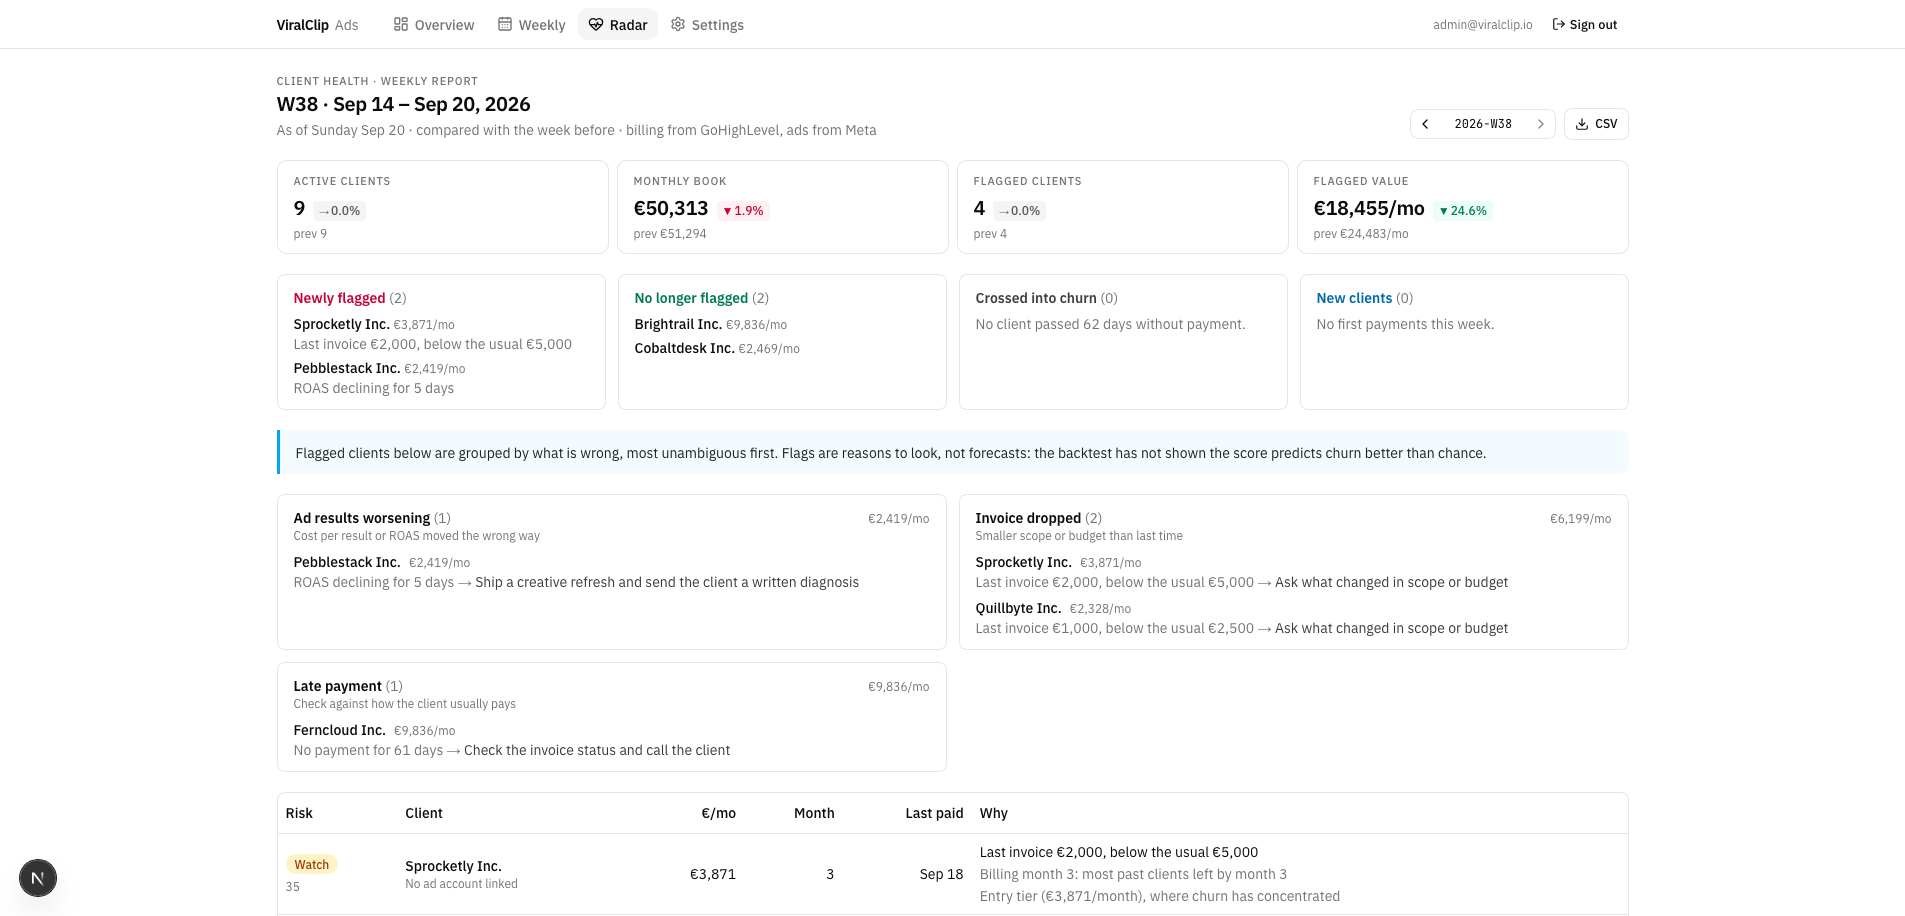 Client-health radar with demo data.
The flags are presented as reasons to look, not forecasts, because that is what the evaluation supports.
Running every week
A worker job runs every Monday: it syncs the latest payments, builds the report, and stores a snapshot of every client’s score, so each flag can later be checked against what actually happened. A Slack digest with the same content is available.
Next Steps
Throughout the development of this project, I started better understanding the core of their business, I gained domain knowledge on their vertical and it helped fill in ideas for future use cases. These are some further potential use cases I came up with:
- Create outbound lead automation, targeting their ICP clients. Analyse their ICP through their business context, learning through both closed and rejected deals from their CRM directly, and constantly improving it.
- Granting write access to the CRM and improving customer satisfaction by actively informing them of their performance changes and what Viralclip is doing to improve them.
- Assigning ad accounts to their employees directly, tracking employees individual performance, so management can better asess how they are doing and if they might need reinforcement meetings.
Overall I enjoyed working on this project, learning a new vertical and I was able to provide real value to an already successful, growing company.